How To Measure Your Basal Metabolic Rate and Why It’s Important That You Do

What’s in the mirror? Hopefully, you see a beautiful you, but if you’re like most of us, there’s more pounds on that frame than is healthy. More than half us are overweight. Time to measure your Basil Metabolic Rate, and target a lower body weight goal. Here’s how to do it… (check out the three infographics)…
 EVER NOTICE how nearly all the people in old movies are far leaner than in current movies? Yes, it’s obvious that over the last 40+ years, the people of the industrialist world are getting progressively heavier.
Time for a reset.
This post is about:
1. Getting some clarity about the damage that those extra pounds can do to your health and well being;
2. Resetting your caloric target based on your Basil Metabolic Rate and activity level; and
3. Taking some physical action with a most simple and effective exercise.
Let’s go!
Below are three infographics that tell the tale:
- One clearly depicts America’s over weight/obesity problem (mirrored by much of the industrialized world, by the way);
- One indicates how calories in and out must be understood to help solve the eating part of the problem; and
- One offers a simple activity to help solve the sitting part of the problem.
First up is “Infographic #1: Obesity”, and it peppers us with the daunting statistics about obesity, as well as average, run of mill overweightyness.
(Yes, I made up the word and I like it.)
Obesity
The Obesity infographic below states that:
- Nearly 55% of Americans are overweight, and
- About 25% of Americans are obese.
If you suspect these numbers appear too low, a trip to the mall might confirm your suspicions. As you scan the bevy of shoppers, your perceptions may suggest that 25% obese and 55% overweight might be a tad on the light side.
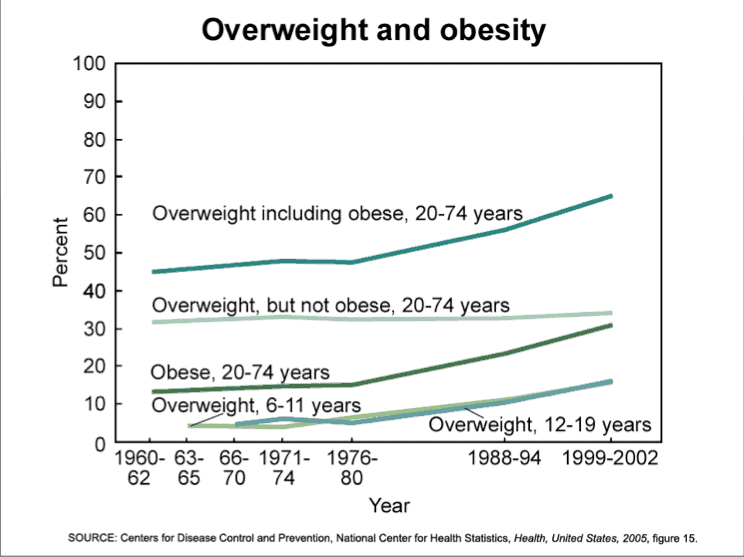
Indeed, the reliable U.S. Centers for Disease Control and Prevention (“CDC”) puts America’s adult obesity rate at 36%, 11 percentage points higher than what’s shown in the Obesity Infographic., and the percent overweight (including obesity) at about 65%; again, 11 percentage points higher.
Here’s the CDC graph depicting these numbers:
If these statistics don’t alarm you, perhaps because you just sat your skinny self down to read this after a 15 mile run, consider that obesity combined with diabetes (Dr. Hyman’s so-called “diabesity“) is becoming a national health catastrophe that will affect everyone via a crippled American health care system.
So, listen up.
Back in 2009, I wrote in a post called, The Seriously Serious Problems of Obesity, which cited a New York Times’ projection that 43% of Americans will be obese by 2018.
When you add that number to total overweight, will anyone be able to do more than waddle from building to car come 2018?
Thus, this first infographic sounds the alarm bells. Check it out, and then scroll down to “Infographic #2: Calories”.
Unless readers of this blog are exclusively health nuts, odds are that the Obesity Infographic hit a nerve.
Perhaps, then, there’s appetite for Infographic #2: Calories.
Calories
Calories measure the energy we get from consuming, digesting and using food.
These days, there’s much debate about the quality of calories, meaning that food source of the calories determines the extent to which the body produces energy (or fat).
For instance, 200 calories of candy will affect your body differently than 200 calories of avocado.
Due to the sugar content, the candy will cause a fast spike in your blood glucose level. At this point – all other things being equal – if you don’t use this extra energy, some portion of the associated calories will be parked as fat.
“Yes”, the body is saying, “we’ll just store this excess energy as fat until you need it later, like during the winter when food is scarce”.
Now, this Calorie Infographic takes the bold step of declaring an ideal proportion of macronutrient mix. Given the wide range presented: 10-25% Protein, 20-35% Fats, 45-65% Carbs, some ratio within this mix should be adequate for most people.
Serious weightlifters might want more protein. Long distance aerobic types might want more carbs. And there are unusual individuals who live on either side of the bell curve, and thereby simply have to find their individualized macronutrient mix.
Just make sure that, more times than not:
- The carbs are complex (low glycemic), unless ingested prior to a one hour plus exercise routine when simple carbs will be used to fuel rigorous activity;
- The fats are mostly omega-3 fatty acids; and
- The protein is from lean, grass fed meat, no-mercury fish or preferably organic vegetable sources.
OK, here’s a primer on calories…
How to Determine Your “Stable” Daily Calorie Intake
Here, we’re going to dive into determining the amount of calories necessary to sustain you at your current activity and weight level, and then at the weight objective (aka “target”) you may desire.
First, calculate your Basil Metabolic Rate (“BMR”)
The BMR is the daily amount of energy your body expends at “rest”, as measured in calories. (source)
Note that “rest” doesn’t mean sleeping or lounging on the couch, but refers to normal daily activities. It does not include any vigorous activities, whether it be a long walk, weightlifting or mountain bike ride.
It might be a bit hard to read the equation part in Calorie Infographic found under the header, “How to Determine Your Daily Calorie Intake”, so I’ll type it out.
The Basil Metabolic Rate formula looks like this:
Females: 655 + (4.35 x weight in lbs.) + (4.7 x height in inches) – (4.7 x age in years)
Males: 66 + (6.23 x weight in lbs.) + (12.7 x height in inches) – (6.8 x age in years)
According to Answers.com, in the USA the:
- Average female’s height is 63.75 inches (5’3.75”) at 152 pounds.
- Average male’s height is 69 inches (5’9”) at 180 pounds.
It’s taking me too long to find a reliable average age for men and women in the U.S., so for purposes of this example, I’m going to use 45 for both genders.
Plugging these numbers in the above formulas:
Average Female: 655 + (661) + (300) – (212) = BMR of 1,404
Average Male: 66 + (1,121) + (876) – (306) = BMR of 1,757
Second, determine your activity level
The next part of determining your daily caloric target is to adjust your BMR number by your activity level. The Calorie Infographic presents various multipliers for that starting at 1.2 for the sedentary life style to 1.9 for “extra active”.
Read the descriptions related to each multiplier and choose the one that best fits what you actually do, not what you wish you were doing.
If our very average man or woman in the above example were smack in the middle of the high to low activity level, his/her multiplier would be 1.55.
Third, calculate your “stable” daily caloric intake
The daily caloric intake (consumption) target is the BMR multiplied by the activity level multiplier. For our average candidates, that would be:
Our Average Female’s Caloric Intake: 1,404 (BMR) x 1.55 (Activity Level) = 2,176
Our Average Male’s Caloric Intake: 1,757 (BMR) x 1.55 (Activity Level) = 2,723
At this point, there are three comments I’d like to make about this BMR/calorie stuff:
1. It’s highly unlikely that your numbers are the same as these examples, so don’t think that these results fit you. Plug in your own particulars into the appropriate equation given your gender.
2. If you have a lot of muscle, it will affect the BMR formula results. Muscle weighs more than fat, so a 5’8” male body builder could weigh 195 pounds and have no excess fat at all. Also, muscle burns more calories at rest than fat. The result is that these formulas may not be relevant for muscled people.
3. Realize that the daily caloric intake numbers here calculated so far are the calories required to maintain the current body weight of these average people profiles. That’s why I used the word “stable”, referring to keeping the current weight stable.
Fourth, calculate your daily caloric intake target
If you want to lose weight, there’s another – lower – caloric intake number, and we’ll call it the “daily caloric target”
So, if our average male said, “I’d be a hell of a lot better off if I weighed 160 pounds instead of my portly 180” (hmm, does anybody really refer to themselves as “portly”?), then he could pop “160” into the BMR formula, adjust his activity multiplier if he was going to increase his activity, and then calculate his caloric intake target.
Given the lower weight inputted into the formula, unless the activity level multiplier offsets the new weight input, the caloric intake number will be lower.
In other words, our pal will have to consume fewer calories to drop the weight. Makes sense, yes?
Walk
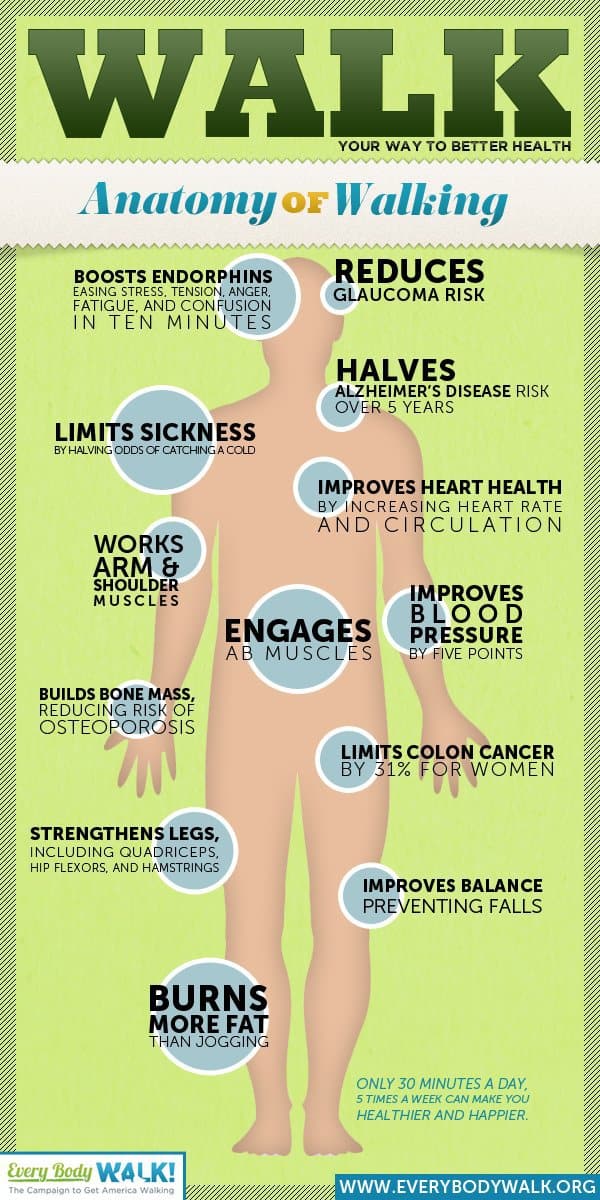
Last up is “Infographic #3: Walk”.
Indeed, for many people, walking is the first step (ha!) toward integrating sufficient activity into their lives to help lose weight and get fit. Everyone knows how to do it, and no special equipment is required.
Check out all the benefits attributable to walking in the Walk Infographic:
That’s a heck of a long list of good things. Surely, walking does a body good.
Now, it’s unlikely that you’ll ever be able to bench press your body weight, run a marathon or fold yourself into a pretzel simply by walking a lot. But if the only thing you’ve been exercising of late it your TV’s remote control, walking is a good way to begin getting active.
Three Conclusions
1. Yes, you are phenomenal, but you may also be a bit overweight. Unless you’re packing a lot more muscle than average, use the BMR and caloric formulas above to determine the calorie target to get to your ideal weight.
2. If you’re more than a wee bit overweight, stare hard at the Obesity Infographic and consider what actions you may be willing to take. Then do #1 above. And #3 below.
3. Unaccustomed to exercise? Well, try walking. Start by noting all the associated health benefits derived by walking, recruit a buddy or two, and get marching.
Over and out.
Don’t forget to share this with someone who might be interested, and comments are always welcome (scroll down for that).
Yep.
P.S. Many thanks to L.A. Bariatrics, Greatist and Everybody Walk for their wonderfully illustrative infographics!
Last Updated on February 28, 2022 by Joe Garma


