
Discover Your Biological Age With These 4 Tests, Part 2: PhenoAge

PhenoAge not only accurately predicts your biological age, but be can measured with nine common blood tests. Don’t you want to know how old you really are?

PhenoAge, also called Phenotypic Age, is the third method of testing biological age that I want to show you for some very good reasons that you’re about to learn about.
In Part 1, of this three-part series, you learned about bioage tests based on surveys of a person’s lifestyle factors, such as smoking, diet and exercise, as well as a novel facial recognition test based on artificial intelligence. Next week, in Part 3, I’ll describe epigenetic tests that measure how lifestyle factors wind up influencing gene expression; meaning, how various genes can be turned “on” or “off”.
Here in Part 2, you discover how PhenoAge can predict mortality risk among people of the same chronological age, as well as a person’s biological age, which can be very different than his/her chronological age.
To give you context, the four biological age tests covered in this three-part series are:
- Survey-based (Part 1)– Evaluates your answers to questions about lifestyle factors thought to impact aging
- Physical/Emotional Tests (Part 1) — Assesses responses to physical and emotional outputs
- PhenoAge Test (here in Part 2)– Quantifies bioage using utilizing nine blood biomarkers
- Methylation Tests (to be covered in Part 3)– Measures patterns of methyl groups on DNA associated with gene expression
PhenoAge is a term used interchangeably with “Phenotypic Age, which is derived from “phenotype, measurable characteristics or traits of an organism.
The amazing thing about PhenoAge is that it’s a very accurate predictor of mortality and biological age, which simply put, is how old your body is in terms of biological function relative to calendar years.
If you’re at all interested in improving your healthspan or in longevity, you will want to know your PhenoAge, or biological age.
Here's what we're going to cover in this post:
Let’s get cracking..
What is PhenoAge and Why Does It Matter
 Dr. Steven Horvath |
 Dr. Morgan Levine |
In their 2018 research paper An epigenetic biomarker of aging for lifespan and healthspan published in in the journal Aging, authors Dr. Morgan E. Levine, Dr. Steve Horvath, et al identify reliable biomarkers for aging, whereby they:
- Used an elaborate DNA analysis of nine blood samples to find what they call the DNAm PhenoAge, a measure of the degree of DNA methylation present in genes, which is a phenomenon associated with aging. (DNA refers to DNA, as in the deoxyribonucleic acid that encodes genetic instructions , and “m” refers to mythelation.)
- Then correlated this measure with Phenotypic Age, showing that they track very well.
According to their research, supported by the gerontology field at large, everyone has two ages:
- A chronological age — your calendar years; and
- A phenotypic or biological age, basically the age at which your body functions as it compares to average fitness or health levels.
The PhenoAge measurement is optimized to differentiate mortality risk among persons of the same chronological age, using data from a variety of multi-system clinical chemistry biomarkers, which is a sciency way of saying “blood tests”. In addition to predicting mortality, PhenoAge accurately predicts biological age — the age of your body relative to chronological age.
In general, a person’s Phenotypic Age signifies the age within the general population that corresponds with that person’s mortality risk.
For example, two individuals may be 50 years old chronologically, but one may have a PhenoAge of 55 years, indicating that he/she has the average mortality risk of someone who is 55 years old chronologically; whereas the other may have a PhenotAge of 45 years, indicating that he/she has the average mortality risk of someone who is 45 years old chronologically.
People of the same chronological age aren’t all at the same risk for developing cardiovascular disease or cancer or even dying. Biological age provides a better idea of a person’s health given their chronological age, which directly relates to healthspan — those years a person is healthy.
PhenoAge is distinct from other methods that measure biological age, as it predicts time to death (mortality) based on DNA methylation and biochemical markers of age-related disease. These biochemical markers are nine blood tests:
- Albumin – Liver function
- Alkaline Phosphatase – Liver function
- Creatinine – Kidney function
- Glucose – Metabolism
- C-reactive Protein – Inflammation
- Lymphocyte – Immune System
- Mean Cell Volume – Immune System
- Red Cell Distribution Width – Immune System
- White Blood Cells – Immune System
Drs. Morgan and Levine’s study also estimated PhenoAge Acceleration (PhenoAgeAccel), which represents PhenoAge Age after accounting for chronological age. This means that PhenoAgeAccel measures whether a person is s older or younger than expected physiologically.
Those with more diseases are biologically older
Overall, participants with more diseases had older PhenoAges. For instance, among young adults, those with one disease were 0.2 years older phenotypically than disease-free persons, and those with two or three diseases were about 0.6 years older phenotypically. (Those fractions are more significant than you might think at first blush, which I’ll address later.)
After adjusting for chronological age and sex, PhenoAge was significantly associated with all-cause mortality and cause-specific mortality (with the exception of cerebrovascular disease mortality).
People who aged the top 5% of the fastest agers in the cohorts had a 62% higher risk of premature death than people with an average PhenoAge, and a 158% higher risk of premature death than the slowest agers.
The DNAm PhenoAge clock predicted that the median life expectancy at age 50 was approximately 81 years for the fastest agers, 83.5 years for average agers, and 86 years for the slowest agers.
The graphs below show that those with the highest PhenoAges relative to their chronological ages had much steeper declines in survival over the approximately 12.5 years of follow-up:
- Graph A shows little divergence between the lowest (blue line) and highest risk (red line) groups among the relatively young PhenoAge participants.
- Graphs B thru D shows that sequentially older age groups showed a progressively larger divergence in mortality between the lowest and highest 20% of participants.
Kaplan–Meier curves for persons in the highest 20% versus the lowest 20% of PhenoAgeAccel.
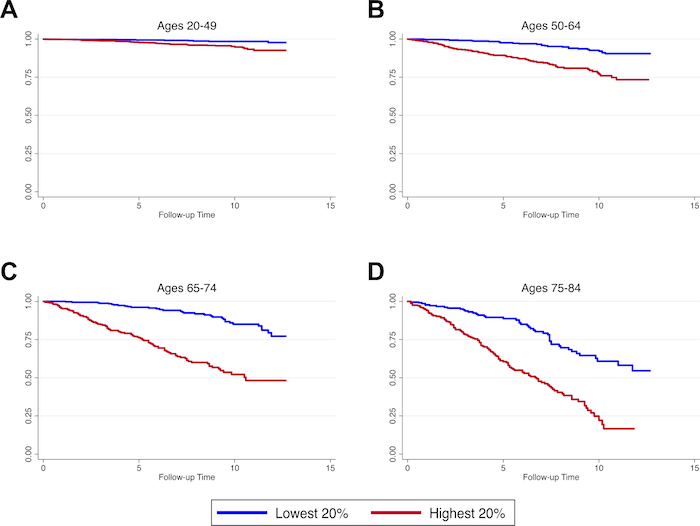
Kaplan–Meier curves are used to estimate the survival function from lifetime data. More info at https://en.wikipedia.org/wiki/Kaplan%E2%80%93Meier_estimator
The findings demonstrated that each one-year increase in DNAm PhenoAge was associated with a:
- 9% increase in all-cause mortality,
- 10% increase in cardiovascular disease-related mortality,
- 7% increase in cancer-related mortality,
- 20% increase in diabetes-related mortality, and a
- 9% increase in chronic lower respiratory disease mortality, and
- for every 5-year acceleration in a woman’s epigenetic aging, her risk of developing breast cancer increased by 15%.
Those biologically older are sicker
It makes sense that if those with more diseases are biologically older than their chronological age, that the inverse would also be true — that those who are biologically older are sicker.
In a subsequent paper published in 2019, Drs. Levine and Horvath, et al, presented two graphs that show overall disease counts and those by age, and the predicted increase in PhenoAgeAccel for each disease count by age category.
Let’s look at each and get some understanding about what they portend.
The graph below presents the disease counts overall and by age category. Approximately two-thirds (64%) of the study participants were disease-free at their interview, while 22% reported having been diagnosed with one chronic disease, 9% reported two diseases, 3% reported three diseases, and only 2% reported at least four coexisting chronic diseases.
As expected, the majority (87%) of young adults (aged 20–39 years) were free of disease, compared to 59% of middle aged (40–64 years) and only a quarter (28%) of older adults. Additionally, 7% of older adults had four or more chronic diseases, while only 1% of middle aged adults, and essentially no young adults reported four or more disease diagnoses.
Disease Counts Overall and By Age Category
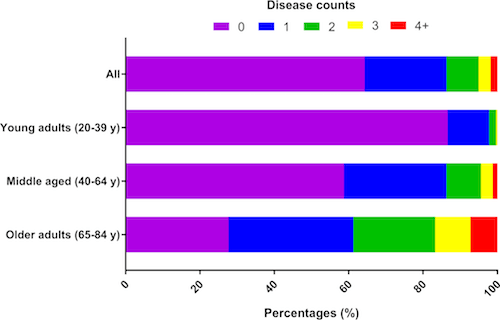
The y-axis depicts the various age groups. The x-axis represents the relative proportions of persons in each disease count category (designated by colors).
As you might expect, the older you get, the more likely you will have one or more diseases. And, again, as you might expect, the more diseases you have the more accelerated is your aging process.
The graph below shows predicted increases in PhenoAgeAccel for each disease count category, compared to persons with no diagnosis of disease.
Predicted increase in PhenoAgeAccel for Each Disease Count by Age Category
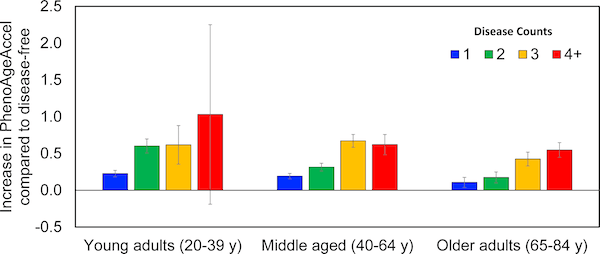
The y-axis depicts the increase in PhenoAgeAccel compared to persons who were disease-free. The x-axis shows groups categorized based on chronological age and the number of diseases each participant had. For all age categories, we observed that PhenoAgeAccel was positive among persons who were diagnosed with 1 or more chronic diseases.
Overall, participants with disease had older PhenoAge compared to those without disease. For instance, among young adults:
- Those with one disease were on average 0.2 years older phenotypically than disease-free persons, and
- Both those with two diseases and those with three diseases were about 0.6 years older phenotypically.
Looking at the above graph, in middle aged adults, compared to those who were disease-free:
- Those with one disease had a PhenoAge that was on average 0.2 years older,
- Those with two diseases had a PhenoAge that was 0.3 years older,
- Those with three diseases had a PhenoAge that was 0.6 years older, and
- Those with four or more diseases had a Phenotypic Age that was 0.7 years older.
Finally, for older adults, PhenoAge increased consistently as a function of disease count:
- Those reporting one disease having a Phenotypic Age that was on average 0.1 years older than disease-free participants,
- Those with two diseases having a PhenoAge 0.2 years older,
- Those with three diseases having a PhenoAge 0.4 years older, and
- Those with four or more diseases having a PhenoAge 0.6 years older.
So, you might be thinking, Gee, I can live an unhealthy lifestyle and get four diseases by the time I’m old and only accelerate my biological age by 0.6 years!
Well, not so fast grasshopper. These numbers are averages. Rather than look at the specific number associated with some chronological age range plus some number of diseases, consider the relative difference between them. For instance, those with PhenoAge of 0.6 older in the 65 to 85 year-old cohort with four-plus diseases has a bioage accelerated rate that’s six times that of the same age group with one disease.
Perhaps you don’t have a specific disease that’s been diagnosed. That’s good, but there are other biomarkers that are linked to accelerated aging, the Levine/Horvath study found. Accelerated PhenoAge (again, referring to those whose bioage is older than their chronological age) was linked with:
- Higher inflammatory biomarkers (such as C-reactive protein),
- Higher insulin, higher glucose,
higher triglycerides, and - Lower HDL.
This, in part, is why those nine blood test markers are so relevant — they express what’s happening with your overall health and, potentially, the formation of disease. For instance, a high fasting blood glucose measure is a predictor of adult-onset diabetes, and high triglycerides/low HDL is a predictor of cardiovascular disease.
Next up, we’ll look at which lifestyle factors can reduce your aging rate (bioage < chronological age) or accelerate it (bioage > chronological age).
The Lifestyle Factors That Make You Younger or Older
The PhenoAge methodology clearly shows statistically relevant lifestyle factors that either make you younger or older relative to your calendar years.
In the graph below, the PhenoAge study reveals that:
- Education, income, exercise, proxies of fruit/vegetable consumption, and HDL cholesterol are negatively associated (blue) with DNAm PhenoAge, i.e. younger epigenetic/bioage age.
- Conversely, CRP (C-reactive protein), insulin, glucose, triglycerides, BMI, waist-to-hip ratio, systolic blood pressure, and smoking have a positive association (red) with DNAm PhenoAge.
Lifestyle Factors Versus PhenoAge Acceleration In Blood
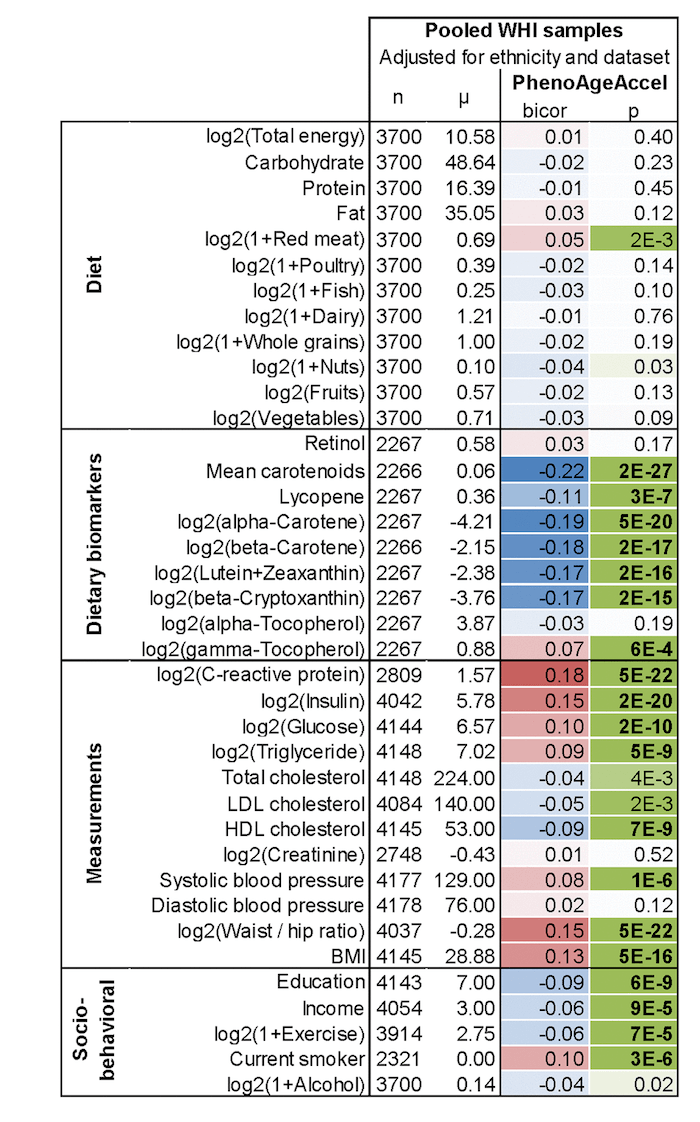 As you can see in the above chart, the darker the red or blue color, the stronger the statistical strength of the association with a specific lifestyle factor (as denoted by bicor (see definition) and p-value (see definition). For instance, among negative factors (those that prematurely age you), inflammation (measured by C-reactive protein) is a darker red than red meat; therefore, although they both are pro-aging factors, inflammation is relatively worse than red meat consumption.
Looking at each category of lifestyle factors, we can observe:
Diet
-
- Good — Fish, whole grains, nuts, fruits, veggies
- Bad — Red meat
Dietary Biomarkers
-
- Good — Cartenoids, carotenes, lutein, etc. (all markers for fruits and veggie consumption)
- Bad — Gamma tocopherol (the major, and unhealthy form of vitamin E in corn and soybean oils that are a major staple of the American diet. See more.)
Measurements
-
- Good — HDL cholesterol
- Bad — C-reactive protein (inflammation), insulin, waist-to-hip ratio
Socio-behavioral
-
- Good — Education, exercise
- Bad — Smoking
Perhaps none of this is surprising to you. You’ve read it before. But now the science clearly shows what can prematurely age you, or keep you younger than your years.
Next up, how to find out your PhenoAge
How To Measure Your PhenoAge
You can choose two ways to measure your PhenoAge:
- Use my Google Sheets
- Use the AgelessRx test
Joe’s Google Sheets PhenoAge Test
When someone subscribes to this website (do it here), among the goodies I send is a description about how to measure PhenoAge.
Under the BioAge Access tab in the Welcome Aboard page, I show Subscribers how to access the Google Sheets were they can input their nine blood markers that drive the calculation of their PhenoAge.
Here’s a screenshot of the first bit of instruction:

As I wrote before, you’ll need these nine blood tests:
- Albumin – Liver function
- Alkaline Phosphatase – Liver function
- Creatinine – Kidney function
- Glucose – Metabolism
- C-reactive Protein – Inflammation
- Lymphocyte – Immune System
- Mean Cell Volume – Immune System
- Red Cell Distribution Width – Immune System
- White Blood Cells – Immune System
If your doctor doesn’t regularly test you for these blood bio markers, you can get them from Life Extension Foundation:

Chemistry Panel & Complete Blood Count (CBC) (Between $26 and $47)
C-Reactive Protein (CRP) (Between $32 and $56)
I reveal my bioage on this page, and provide more background about how PhenoAge is measured.
AgelessRx PhenoAge Test
If you either don’t want to subscribe to this site and/or don’t want to deal with Google Sheets, and don’t have the required blood tests prescribed by your doctor nor want to purchase them from Life Extension, you can buy the AgelessRx PhenoAge test for $75. (You will still need to go to a blood lab, like Quest Diagnostics to get your blood drawn.)
AgelessRx will hook you up with a lab to get the blood tests done, and then you can enter the numbers on a page they provide that will then calculate your PhenoAge.
Your PhenoAge Takeaway
Remember that independent of your chronological age:
- The higher your PhenoAge, the higher the likelihood of coexisting morbidities
- The higher your PhenoAge, the lower the likelihood of being disease-free
- Higher PhenoAge is associated with an increase in physical functioning problems
- Higher PhenoAge is associated with an increased risk of coronary heart disease
Also remember that:
While your chronological age is fixed to time itself, your PhenoAge can be changed — for better or worse — by the lifestyle factors you choose. So choose wisely
In Part 3, the final piece of this trilogy on measuring biological age, we’ll explore how the science of epigenetics influences gene expression by a process called methylation, and how you can get this tested.
Go To Part 3
Last Updated on December 21, 2021 by Joe Garma
