
How Long Will You Live? Take The Test

Statistics can be damn liars, or so we hope to believe when they cut against what we want. (After all, aren’t we all above average?) And you may feel this way after you take this longevity test, not to mention the body fat calculator. The good news is that as long as you’re alive (and let’s presume you are), you can make some changes that will increase your chances of living a long and strong life. Read on, and take the short test.
UNTIL TODAY, two doors down the hill from my home lived an old friend. He was a pillar of the community. He was 92 and was hale until his last year. He lived the way you’d want to, like on this right side curve here:
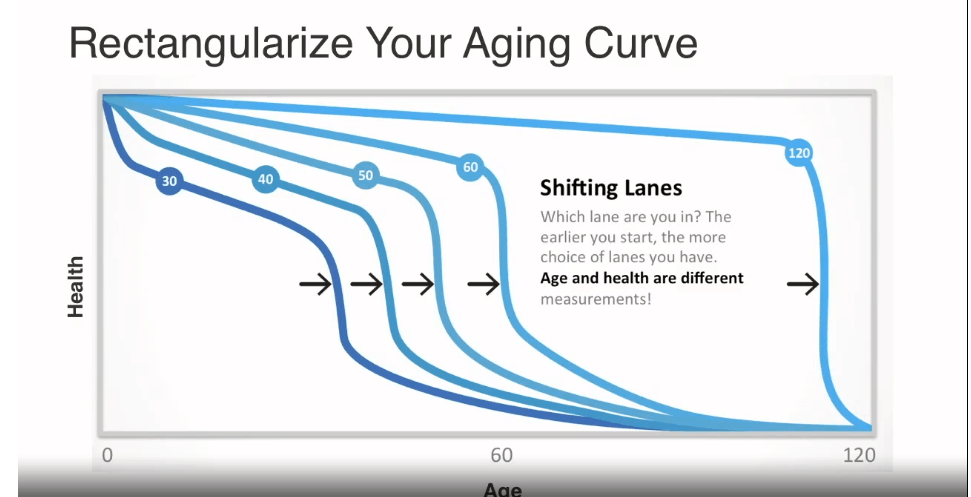
As it says in the graph, “Age and health are different.” My neighbor enjoyed great health until his last year in large part because he always felt that he himself was the greatest influence in his life, that he was responsible for it; no one else. This attitude enabled him to be very productive. He built a multimillion dollar business, fathered three children that begot his three grandchildren. He traveled the world and kept a hand in his work until 91.
In short, he enjoyed his life. It had meaning, to himself, his family, friends and community.
On that graph up there… where you want to live your life is on that right-most curve, whether it lasts till 120 or not.
From all accounts, Jack LaLane did this. He was robust and vital till very near the end, then, in effect, fell off a cliff (as the curve indicates), quickly hurling toward oblivion, rather than teeter tottering near a drool pot in some old people’s home.
Frequent readers of this blog know that I’m pretty darn focused on lifespan. I want to live a long and strong life and have been adopting the behaviors and mindset to achieve it.
There are a few things that are known to improve the length and quality of your lifespan, such as:
– Attitude: A mindset that does not hold on to stress, and keeps you happy and connected to others.
(See Inspirational Alice and Are Your Thoughts Yours?)
– Cleansing: Ensuring that your organs of elimination, such as the kidneys, colon and liver stay in tip top shape so they can eliminate toxins, chemicals and the like before they can do damage.
(See GoH Cleansing/Detox)
– Diet: Food, drink and supplements that a nutrient-dense, easy to digest, non-inflammatory and chocked full of antioxidants, omega-3 fatty acids, fiber, etc.
(See GoH Diet/Nutrition)
– Exercise: Maintaining functional fitness, which means…
o Keeping your lean muscle composition rather than losing it as tends to happen past 30 years of age
o Having a flexible body
o Maintaining sufficient anaerobic and aerobic conditioning to be able to walk up hills carrying, say, a young child
(See GoH Exercise)
Naturally, good genetics is very useful, but as the science of epigenetics informs us, behavior matters. As you’ve probably read somewhere,
“Genetics loads the gun. Behavior pulls the trigger.”
So, how long will you live?
Will you reach your genetic potential, or due to behavioral choices, be infirmed for years before you die at a younger age than what was possible?
There’s at least two things you could do to motivate you adopt a plan to reach your genetic potential:
1. Learn what you genes say about it buy getting a genetic test, and
2. Measure your health via some blood work. Here are my results from a year ago (and I’ll soon report on my recent blood work).
But before you run off and do either of these two things, perhaps you’d like a snapshot of where you’re at right now as measured by probability.
There’s sufficient data mined from millions of other aging humans to indicate how long you will live based upon certain inputs, such as these that run the “Poodwaddle Life Clock” algorithm:
– Where you live
– Current age
– Gender
– Family history
– If you smoke
– How much alcohol you drink
– Body Mass Index
– Blood pressure, cholesterol, blood sugar
– Consumption of fruits, veggies, fat and salt
– Exercise frequency and duration
– Level of stress and happiness
– Education level
– Driving habits
As you can see, you can take the Poodwaddle Life Clock test below, as I did, but before you do, let me tell you a few things, which frankly steer us off course a bit but is interesting stuff, IMHO.
BIG Tangent #1: BMI Can Be Misleading – Here’s an Alternative
The Body Mass Index (BMI) attempts to measure whether you’re about the right weight, overweight, or obese.
But the BMI number is worthless if you exercise consistently and thereby have more lean muscle mass than the average bear, or if you’re very tall or very short.
Take me for example.
At 6’ 4”, I’m not too tall for BMI accuracy, but given that I do resistance training and thereby have more muscle than average, my BMI number of 25 puts me in the “Overweight” zone.
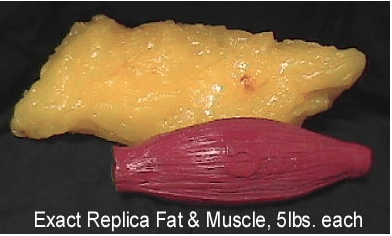
Remember, muscle is more dense than fat. On average, the density of fat is 0.9 g/mL. The density of muscle is 1.1 g/mL. Using the averages, one liter of muscle weighs 1.06 kg, or 2.3 lbs., while 1 liter of fat weighs .9 kg, or 1.98 lbs. (Source)
Thus, if you’re a 5’ 10” male body builder who weighs 210 pounds, you may have a measly 6% body fat by contest time, and yet BMI will show you as much overweight as the guy at your height and weight who curls donuts, not dumbbells. In this instance, both of these fellas would have a BMI of 30, and be labeled “Obese” by the BMI scale.
When I took the Poodie test, I fudged the BMI number. Instead of relying on the BMI number as one of the variables to spit out my likely lifespan (which is inversely related to body fat within the obese range, by the way), I used another calculation of body fat.
The body fat calculation I used is referred to as the “Covert Bailey Body Fat Calculation”, named after Covert Bailey, whose book, Fit or Fat, rocked the fitness world when first published in 1977 with the premise that it’s far more important to measure body fat than overall weight.
Mr. Bailey uses an algorithm to approximate body fat by using these inputs:
- Gender
- Age
- Wrist
- Waist
- Hip
- Forearm
- Thigh
- Calf
I like this body fat approximation because it accounts for factors that are directly related to body fat, body frame and muscle. And, indeed, of the several algorithms I’ve tried, Mr. Bailey’s comes closer to approximating what I see in the mirror.
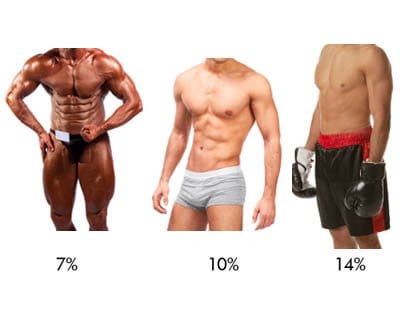
Using the Covert Bailey Body Fat Calculation, I come out at 17.7% body fat. Not great, but not bad for a man my age.
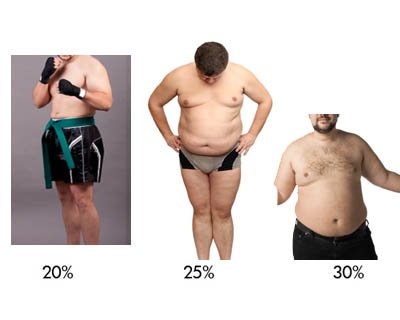
And when I scan the following pictures… yes, that’s about where I fit in the line-up, although you’ll hafta trust me on this since I still need to be employable, so no near-naked pictures of me.
Here are the women’s pictures:
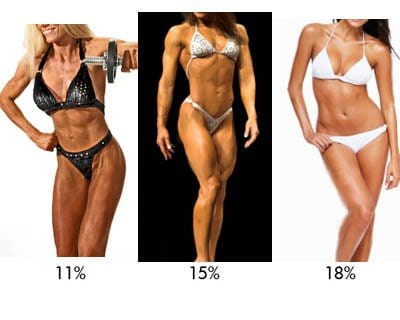
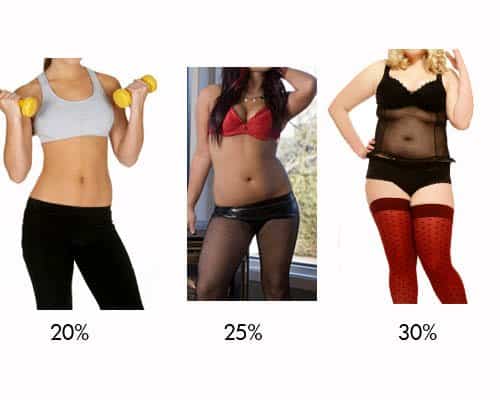
(Thank you Fat 2 Fit Radio for the Covert Bailey algorithm and The Clutch Society for the pics.)
Go here, input your numbers and get your body fat percent number. Then take an honest look at yourself near-naked in the mirror.
Where do you belong in the line up of body fat percentages shown above? Did the Covert Bailey body fat calculator come up with a number that’s confirmed by how you look relative to the pictures?
To minimize self-delusion, have a trusted friend suggest which picture you most approximate. And, by the way, make sure you do not rely on your memory or the stated waist size of your pants for the numbers asked by the Covert Bailey body fat calculator, as both will likely be wrong. Men, the waist size advertised for your pants is smaller than your actual waist size. Chalk it up to marketing.
OK, I hope this all makes sense to you so far, cause the next thing is a real “wing it”.
The question at hand concerns how to adjust the overreaching BMI calculation so that the Poodwaddle Life Clock algorithm does not penalize a person very short, very tall or muscular.
The only thing I can think to do is to reduce the BMI number, which in my case is not accurate, given that this number 25 designates me “Overweight”, which I’m not.
But reduce it by how much?
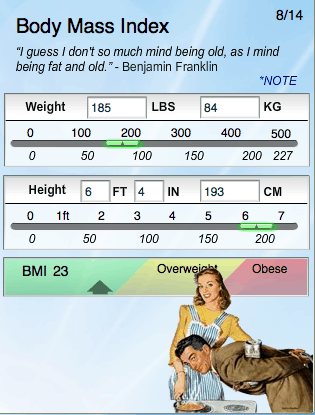
This is where “wing it” comes into focus. I just kept reducing my actual weight (206 pounds today) until the resulting BMI number moved into the top quarter of what you’ll see is the green area designating normal weight. For me, that fudged weight poundage is 185, resulting in a BMI of 23. Here it is:
If you’re real short, real tall or more muscular than the average bear, consider adjusting your BMI calculation the way I did.
But don’t fool yourself.
Despite my beef with the BMI calculation, it is useful for most people, because most people are not really short or tall, or muscular.
BIG Tangent #2: Cholesterol and Fat Considerations
Three guys that I follow via email newsletter and Twitter (among many others in the Paleo diet sect) would gag at the penalty that the Poodwaddle Life Clock test seems to assess those with high cholesterol numbers and/or a high fat diet. They assert that it’s old and inaccurate science that proclaims cholesterol and saturated fat to promote heart disease.
I cover this quite a bit in two posts:
What You Need To Know About Coffee, Saturated Fat and Red Meat, and
Is Meat Good for You? 8 Experts Chew On It, 4 Spit It Out.
In those posts, you’ll read about why Dave Asprey, Mark Sisson, Chris Kresser and other brainy types who maintain that cholesterol and saturated fat, per se, is not a cause of heart disease. More worrisome is a lipid associated with cholesterol called LDL, or “Low Density Lipids”, and inflammation.
The balanced and avuncular Dr. Andrew Weil says they’re on the right track with this article about cholesterol wherein he focuses on LDL that’s too high or HDL (High Density Lipids) that are too low – they being the real concerns leading to heart disease.
The Poodwaddle Life Clock test does break out LDL and HDL and one can assume that it weighs each properly, but the test might penalize too much those with a high total cholesterol number, as well as a mid to high fat diet.
Anyway, on to the longevity test…
How Long Will You Live? The Poodwaddle Life Clock Test
[Per the Update at the top of this post, this test is no longer available.]
My Poodwaddle Life Clock Test Results
[I took the test when it was still available.]
SummaryYour Age: 57.6 years Life Expectancy FactorsThe average life span for your region is 78. You are expected to live 11.3 years longer than average due to your health and lifestyle. GENDER: -2.5 years Men live 5 years less than women. Not much you can do about that. Sulk if you like. FAMILY HISTORY: 1 years Your family history rewards you with a few extra years. Remember to thank your mom. SMOKING: 2 years Since you are not a smoker you gain 2 years over the average life span (15-25 years longer than smokers). If you recently stopped smoking it will take 10 years for the risk of lung cancer to return to that of a non-smoker and 15 for heart attack risk to return to normal. DRINKING: 0 years You could benefit from drinking one or two glasses of red wine per day WEIGHT: 0 years (BMI: 22.5) Your BMI score classifies you as normal. Grats. Go treat yourself to a double fudge, candy topped, chocolate coated, three scoop ice cream cone. You’ve earned it. HEALTH: 0 years Keep living right and maybe you will never have to worry about hypertension, cholesterol, and blood sugar levels. DIET: 2 years You seem to be eating well. EXERCISE: 2 years Exercising 20-40 minutes each day can add many years to your life. HAPPINESS: 0 years Reduce your stress and improve your happiness. As Abraham Lincoln said, “Most people are about as happy as they make up their minds to be.” EDUCATION: 1 years Not surprisingly, higher education equals longer life. DRIVING: 2 years You’re no fool. The average person has a 30% chance of being in a serious accident in their lifetime but your odds are lower than average. |
These results are what they are, but just between you and me, way under par. (You may feel the same way about your results.)
For me, 89 is too young to go out. (Hell, I don’t want to miss the Hyperloop.) No, my intent it to move the bar higher, and this is one big reason that I investigate longevity protocols, follow some, and write about them on this blog.
If you’d like a leg up about what you can do to age longer and stronger, go to https://garmaonhealth.com/category/aging and pick among the many posts that cover the subject. You’ll get lots of insightful tips.
That’s it.
Live long and strong! Like my neighbor did.
Godspeed, Elmo.
Last Updated on February 27, 2022 by Joe Garma
